By Melissa M. Lanclos, Geospatial & Analytics Senior Manage and Qian Song, GIS Administrator
The world in which HARC exists is one of dynamic and extreme events—whether related to natural disasters or public health crises—which drive planning and policy efforts across all levels of government and the private sector. Now more than ever there is a need for science-based solutions and independent analyses that address overlapping economic, environmental, and social issues. With our multi-disciplinary, innovative team, HARC is positioned to address the most pressing sustainability challenges and opportunities.
HARC uses a variety of geospatial and analytical tools to develop data and applications. HARC also has access to a variety of application templates that can be configured to the needs of the project, minimizing the need for in-depth programming, and thus focusing on the more important task of communicating information in an engaging and intuitive manner.
GIS stands for Geographic Information Systems. But what does that mean?
Projects that use data with a geographic (GIS) component are often called geospatial. Because so much of the work the HARC team does centers around projects, we use the term “Geospatial” for our team.
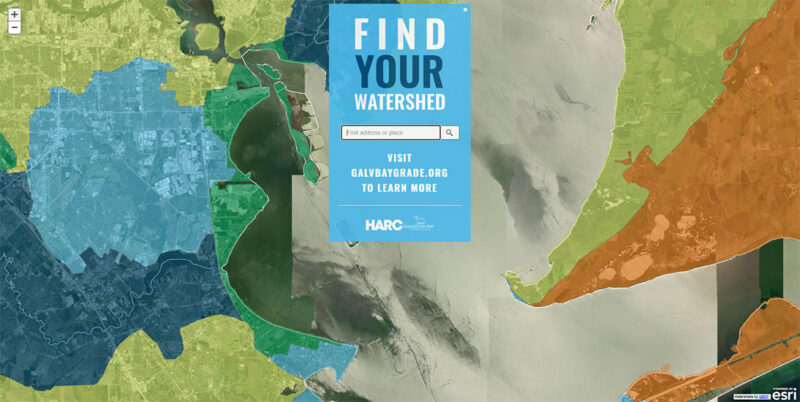
Find Your Watershed
This interactive web mapping application allows users to see the health status of their watershed using data from the Galveston Bay Report Card. By entering your address, you can see the grades for your watershed in six categories including water quality and human health risk.
Winter Storm Uri Experience
Winter storm Uri had a huge impact on most everyone living in Texas. Everyone personally lost power, water, or both, or knows someone that did. This interactive web map is loaded with data, charts, and maps to help you understand what went wrong with the power grid and what changes could prevent another event like this from happening.
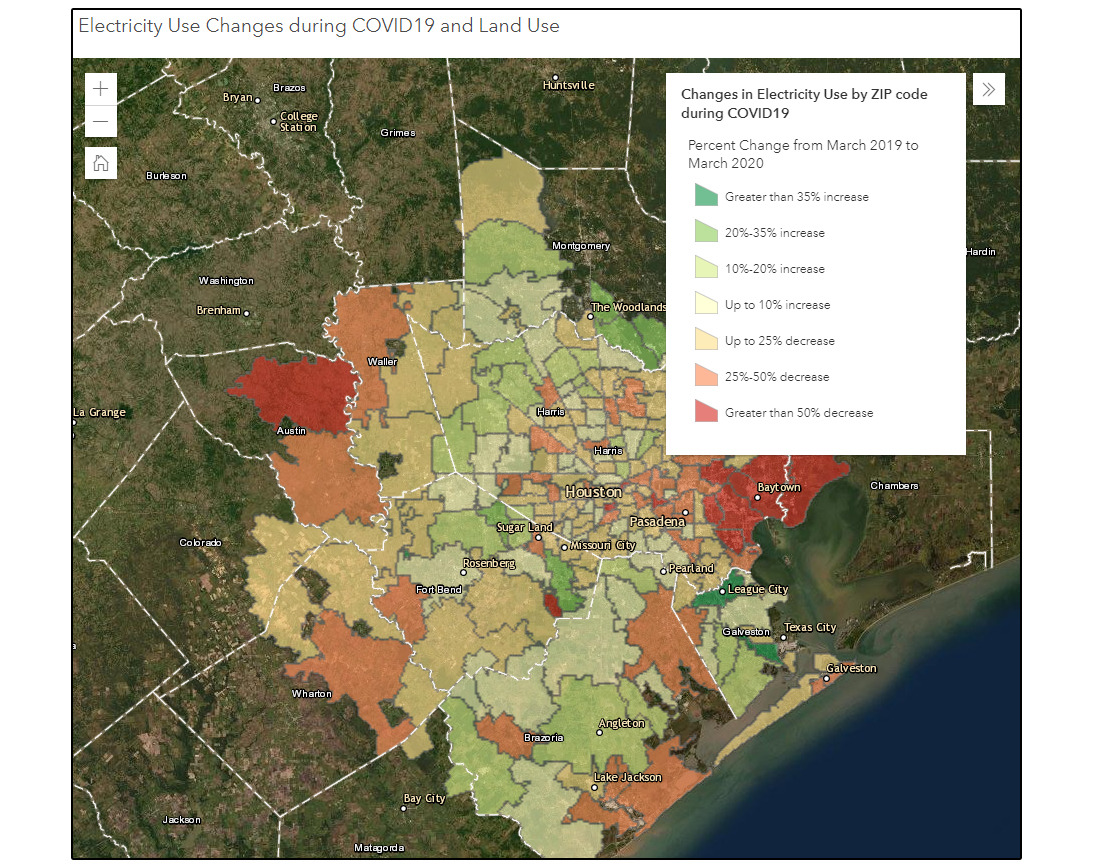
COVID-19 Data Analyses
COVID-19 has affected all of our lives over the last 19 months. HARC in partnership with CenterPoint, Unacast, and TCEQ looked at how the pandemic impacted energy usage as business shifted and more people worked from home. Maps and analysis show the spatial patterns that emerged as we settled into our new normal.
HARC AGOL Site
What is AGOL? It stands for ArcGIS Online, a cloud-based mapping portal created by Esri, Inc. In this modern world of GIS, AGOL creates a way for data, maps, apps, and content to be shared with everyone. Please visit this site to see other exciting content such as a StoryMap about our building, the only LEED certified, net zero building in Texas.
StoryMaps
We have already talked about several projects that incorporate StoryMaps, which are a powerful way to convey data and analysis as a story. You can find other examples of StoryMaps in projects such as RESIN, Hurricane Harvey’s impacts, and Texas Energy-Water Nexus.
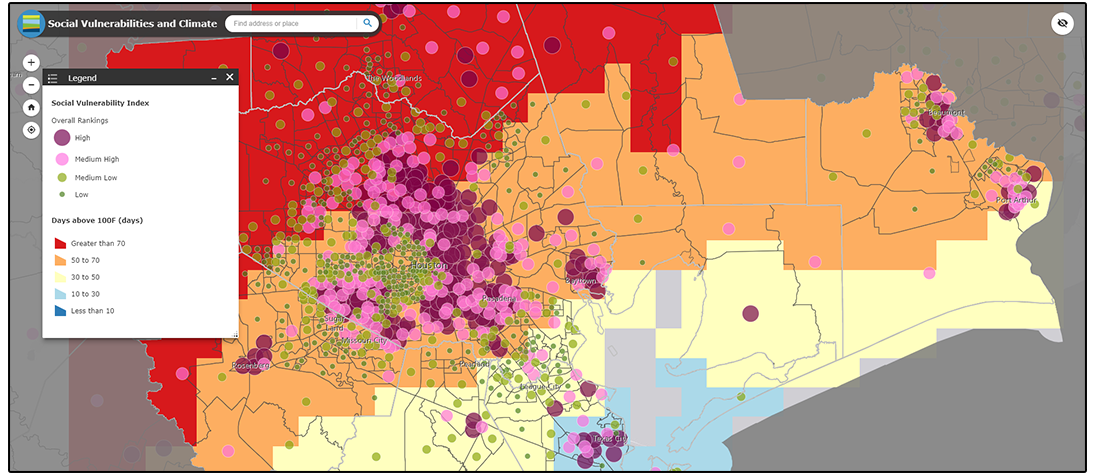
Cartography, the science of drawing maps, is an important skill of the Geospatial team. Maps visualize complicated data to help improve an audience’s understanding. Pretty maps might be one aspect of GIS, but GIS is so much more than that! The true power of GIS is the ability to analyze data, resulting in the capability to answer important community and environmental questions. One great example of this is the RESIN project. It is a powerful combination of gorgeous maps and detailed analysis that come together to provide a compelling picture of the need for community involvement to support climate resiliency.
HARC uses analysis, research, and scientific answers to find solutions for a sustainable future. In doing so, the Geospatial team has access to large amounts of data. Many of those datasets are available for download to help kickstart your own research and projects.
HARC’s team of dedicated experts are readily available to help manage or develop plans for your next geospatial-based project. Contact our team to learn more: